Visualize the spread kernel used by calc_dist_weights()
Source: R/visualize_distance_weights.R
visualize_distance_weights.Rdvisualize_distance_weights() plots the shape of the spread kernel used
by calc_dist_weights() (and, through it, the "continuous" and
"continuous-spherical" methods of calc_bmtr()) for one or more
transition-line lengths. It's meant as a tool for choosing kernel and
its hyperparameters (gamma, kl, s1) before running an expensive
calc_bmtr() call.
Arguments
- line_lengths
A vector of transition-line lengths (m) to visualize the spread kernel for.
- radius_m
The detection radius (m). Defaults to
res_m / 2(the same default used bycalc_bmtr()'s continuous methods). Fortype = "envelope"this is only shown as a reference line, and only if explicitly supplied. Fortype = "raster"it's used, as incalc_dist_weights(), to determine the band of probability density that forms the plotted weight.- res_m
The resolution of the associated bird flow model (m), used to determine the nugget added to the variance. See
calc_dist_weights().- kernel
The kernel used for calculating the standard deviation in the probability distribution:
"m3"(default) Matern 3/2. Driven by
gammaandkl."m1"Matern 1/2. Driven by
gammaandkl."m5"Matern 5/2. Driven by
gammaandkl."sq"Squared-exponential (Gaussian). Driven by
gammaandkl."bb"Brownian bridge. Driven by
s1.
See
visualize_distance_weights()to explore how these kernels and their hyperparameters shape the spread.- gamma
Spread magnitude hyperparameter (m^2, a variance) for the Matern-family and squared-exponential kernels (
"m1","m3","m5","sq"). Ignored forkernel = "bb". The default was tuned by eye withvisualize_distance_weights().- kl
Lengthscale hyperparameter (m) for the Matern-family and squared-exponential kernels (
"m1","m3","m5","sq"). Ignored forkernel = "bb". The default was tuned by eye usingvisualize_distance_weights().- s1
Spread magnitude hyperparameter (units of sqrt(m), not m) for the
"bb"kernel. Ignored for all other kernels. The default was tuned by eye againstvisualize_distance_weights().- type
The style of plot:
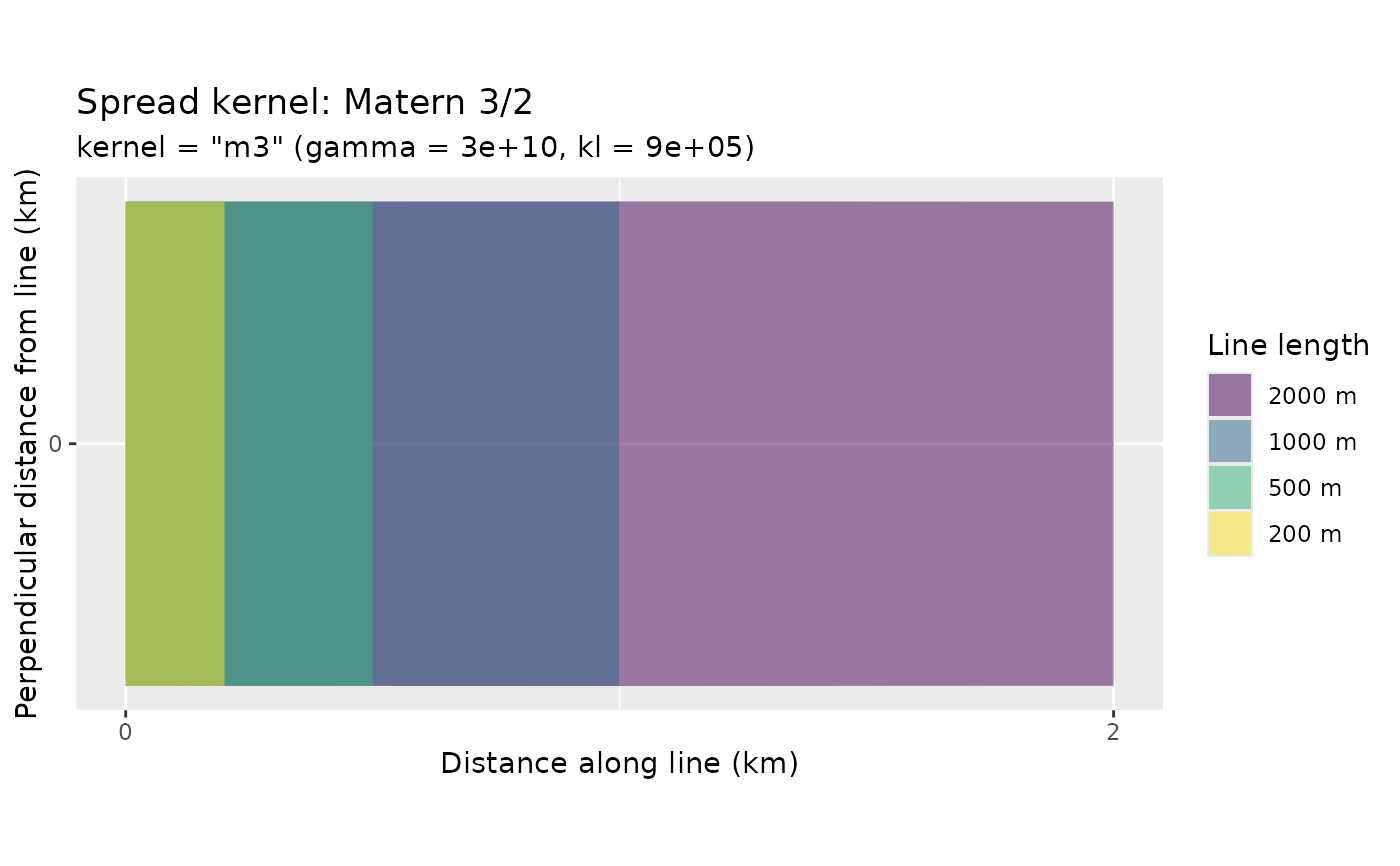
"envelope"(default) For each line length, plots the region within 1.96 standard deviations of the line (in the kernel's probability distribution) as a band along the line. This represents 95 percent of the density.
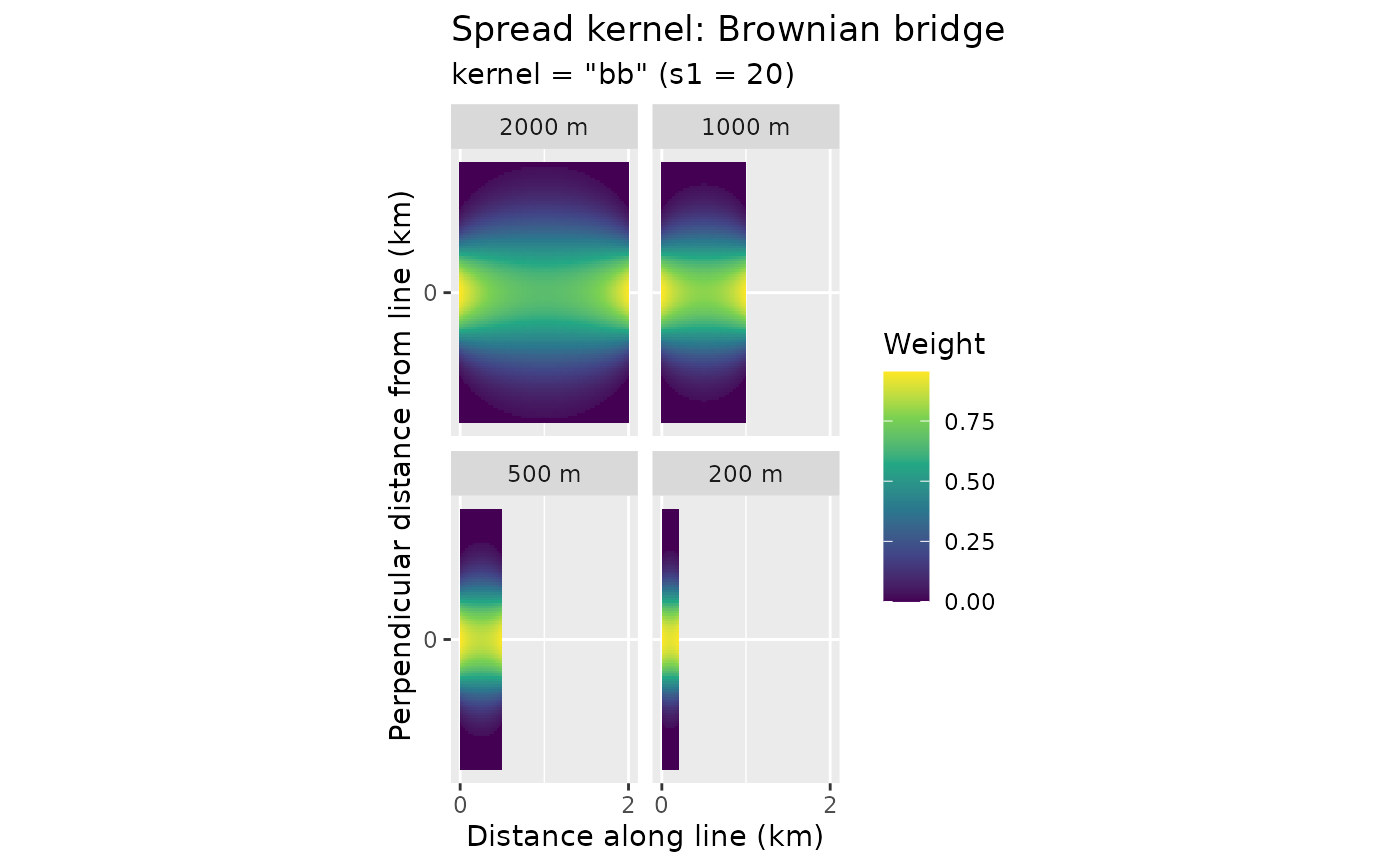
"raster"For each line length, plots the actual weight returned by
calc_dist_weights()over a grid of points around the line, as a heatmap. Slower, but reflectsradius_m's effect on the weight as well as the kernel's spread.
- n
The number of grid points used along (and, for
type = "raster", across) each line.
Value
A ggplot2 object. It can be displayed with print().