BirdFlow Model Overview, Uses, and Limitations
Source:vignettes/BirdFlowOverview.Rmd
BirdFlowOverview.RmdOverview
BirdFlow infers how species migrate from weekly distribution estimates produced by the eBird Status and Trends project. Here’s an example of the input data to BirdFlow, a Status and Trends animation of the weekly relative abundance of the American Woodcock:
We can clearly see the “movement” of the population from week to week, but there is no explicit information about how individual birds moved.
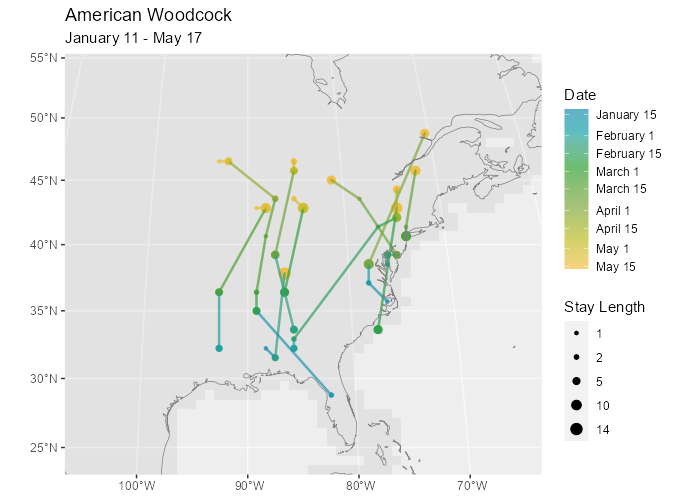
BirdFlow uses the weekly relative abundance information from Status and Trends to create a model for how the species migrates. The model can generate synthetic routes and predict where individual birds are likely to move. For example, here are some synthetic routes for the American Woodcock:

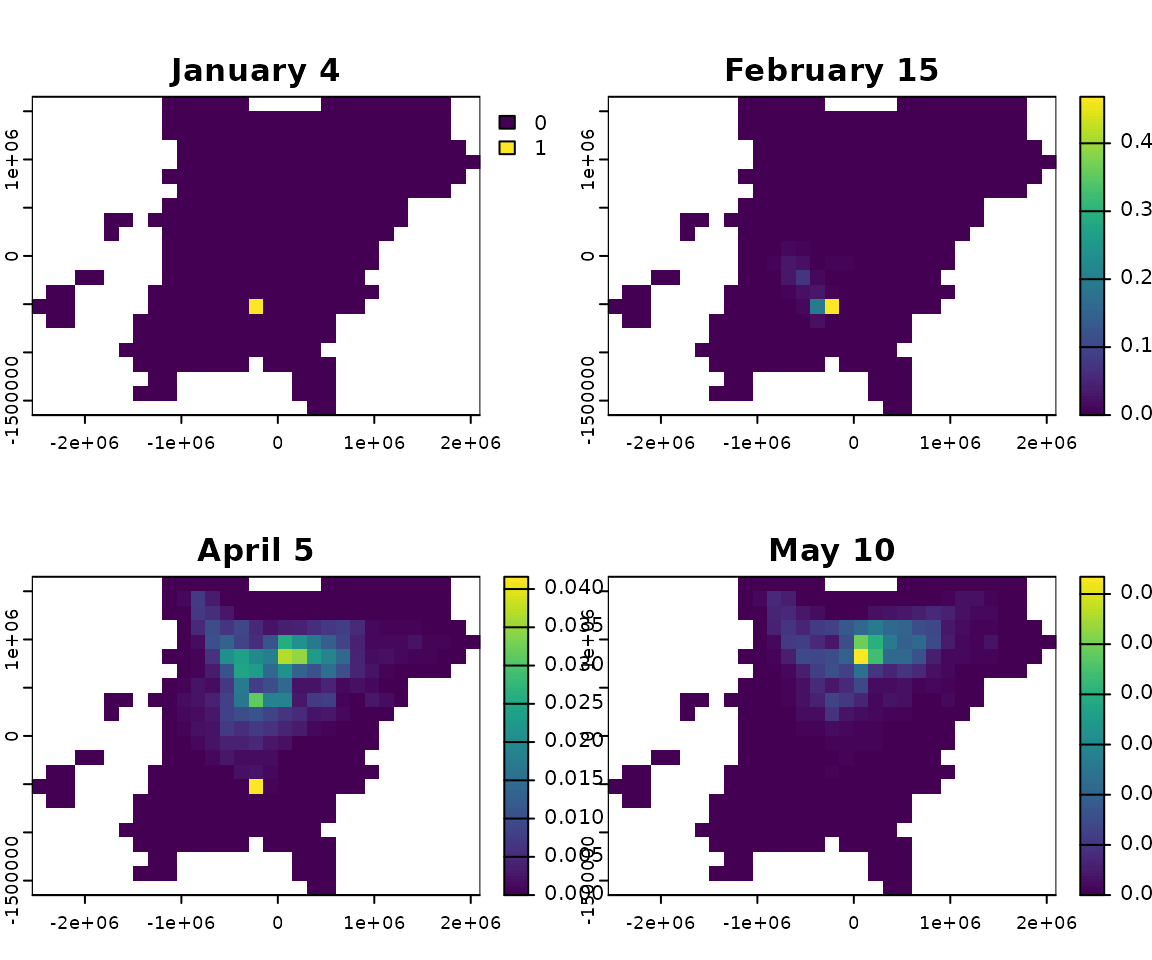
And here are some example forecasts for future locations of a bird
from a particular location during the week of January 4: 
Each plot shows the forecasted distribution of future locations in a given week for a bird that starts in the green square during the week of January 4.
Scientists can use the BirdFlowR package to generate routes, make forecasts, and more using models provided by the BirdFlow team.
How it Works
To understand the appropriate uses and limitations of BirdFlow, it’s helpful to understand a little about how it works. (Much more information is in our paper.) Formally, a BirdFlow model is a probability distribution over routes. In the image above, we saw 10 routes generated by sampling from the probability distribution for a BirdFlow model. A reasonable way to think about a probability distribution, and hence a BirdFlow model, is through the routes it generates. For example, if we sampled a million routes we could learn nearly all the statistical properties of the distribution, such as where routes start, where they end, how much they zig-zag, and so on. What properties do we want this distribution—or these routes—to have? A BirdFlow model is learned or fit by adjusting the probability distribution to balance several criteria encoded in a loss function:
- The locations of the birds during each week should match the Status and Trends distribution for that week. In our example with one million routes, if we take the location along each route for the week of June 28, these million locations should match the Status and Trends relative abundance map for the week of June 28.
- The routes should be biologically realistic, for example, they should not zig-zag all over the map or move unrealistically far in one week. This is achieved by a component of the loss function based on distance of migratory transitions.
- The routes should be appropriately “dispersed”. Birds in one location shouldn’t all go to exactly the same next location, nor should they fly in completely random directions. BirdFlow uses an entropy term in the loss function to encourage enough dispersion.
“Memorylessness”
An important property about BirdFlow models is that they are “memoryless”: when generating a route, a bird’s next location depends only on its current location, and not on the full sequence of past locations. In other words, there is no “state” or “memory” for a bird other than it’s current location. For example, the model does not track a bird’s energetic reserves or intended destination. Mathematically, the model is a Markov chain. There are good computational and statistical reasons for this choice, but it limits the use in some ways we will describe more below. In the future, we intend to try different types of models, but there will always be tension between model complexity and available data—fine-grained behavior could be hard to learn from Status and Trends data. In fact, a memoryless model is optimal for the BirdFlow loss function that captures the criteria described above.
Interpretation and Uses
How should BirdFlow’s routes and forecasts be interpreted? It’s important to remember synthetic routes are not the same as the routes of real tracked birds. The guarantee is that if you put together many synthetic routes, they will match the population-level properties from Status and Trends data. Further, we tune the model so routes are biologically plausible: they don’t travel farther than needed, don’t zig-zag too much, etc. Most BirdFlow models are also tuned with some tracking data so the dispersion in movements roughly matches that of tracked birds from the same species—for example, if we take a real tracked bird and forecast a distribution of its next location, then about 90% of the time its actual next location should fall within a 90% probability region of the forecasted distribution.
BirdFlow is exciting because it can synthesize and forecast migration routes for many species across their entire range without needing extensive tracking data. In general, we expect BirdFlow to capture coarse-scale properties of a species’ migration well, which could have exciting potential uses:
- Provide synthetic migration routes that match observed population-level properties
- Quantify broad-scale directionality of movement
- Inform where birds in a given location are likely to go next, or where they came from, for example, to help understand spread of diseases like avian influenza
- Explore hypotheses about migratory connectivity
- Compare statistics of movement across species
Limitations
It’s also important to understand the limitations of BirdFlow. The primary evidence used to fit BirdFlow models is Status and Trends data. There could be many different models (think: sets of migration routes) that match the Status and Trends data well. For example, we might choose one model where all birds migrate a medium distance, but another model where some birds migrate a short distance and others migrate a long distance might match the Status and Trends equally well. The BirdFlow fitting process has a few parameters that control the types of routes that are selected (e.g., many short hops vs. fewer longer hops, amount of dispersion in routes). In our paper we tuned these parameters to match real routes of tracked birds for 11 species as well as possible, and the resulting models predicted movements of tracked birds significantly better than a baseline model. However, we do not expect BirdFlow’s synthetic routes or forecasts to match real movements in every detail. Some specific limitations are:
- Details of individual routes such as the number of hops, length of stopovers, or lengths of hops may or may not match real routes.
- Due to memorylessness, BirdFlow routes don’t typically have site fidelity (where a bird returns to a location year after year). For this reason we currently recommend using BirdFlow to generate routes and make forecasts for a period of less than one year, for example, a single migration season.
- Due to memorylessness, BirdFlow cannot distinguish between subpopulations with different migration strategies; it would instead mix the two subpopulations. We think this is not a major issue for species with subpopulations that are separated in space or time, but BirdFlow users should be aware of this limitation and consider it in light of their intended use.
- BirdFlow’s time step is weekly and it cannot model movements at a finer time scale, such as daily movements.
- BirdFlow uses a grid to represent locations and cannot model movements at a spatial scale finer than the grid resolution.
- BirdFlow uses Status and Trends relative abundance data as input and requires adequate Status and Trends coverage of a species’ range to create a model. All models we provide are judged to have adequate coverage, but we can’t currently create models for every species.
- Status and Trends relative abundance estimates are great, but not perfect. BirdFlow will reproduce any inaccuracies present in the Status and Trends estimates.