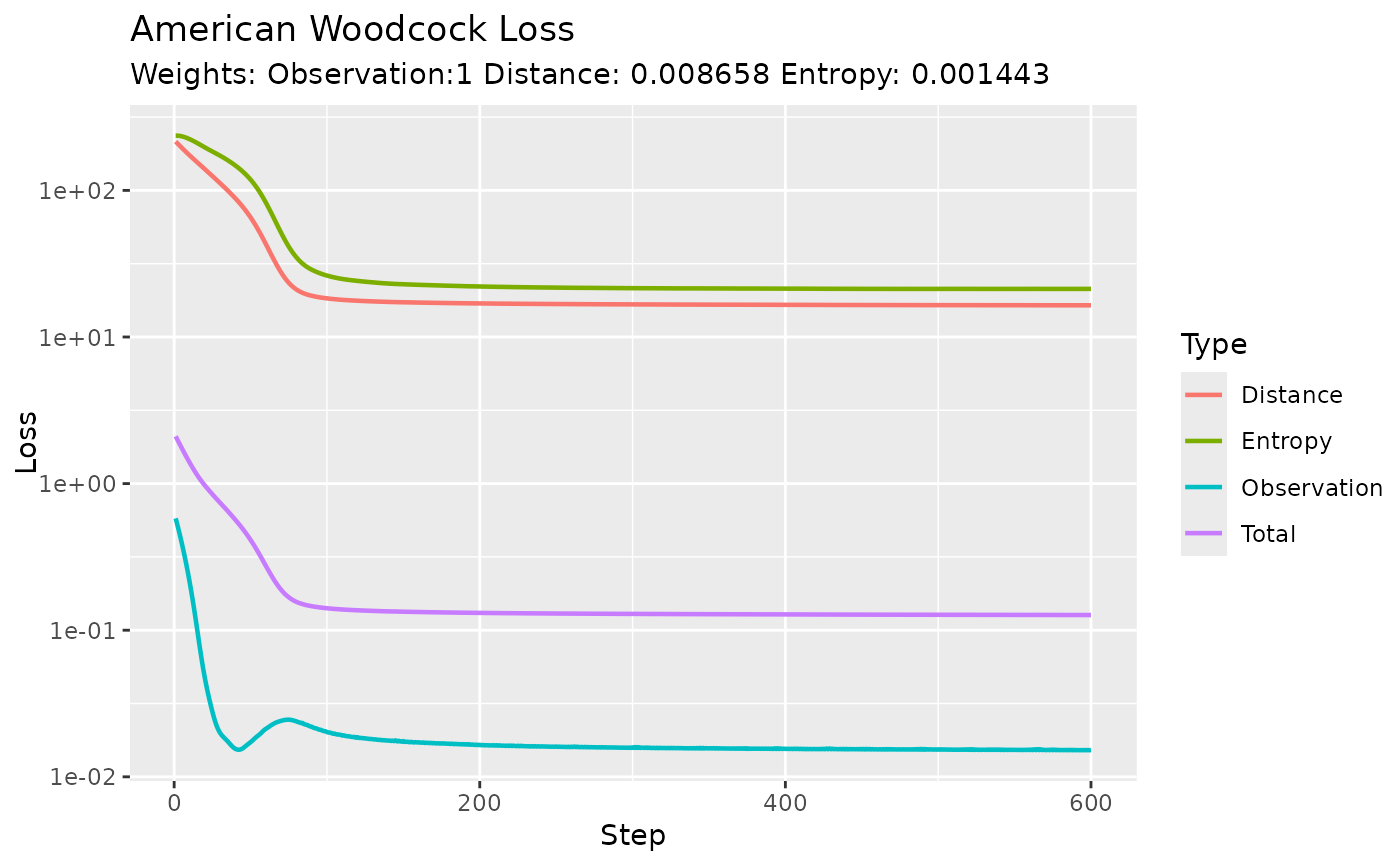
Model fitting - in BirdFlowPy - attempts to minimize the total weighted loss. This plot shows four lines:
Total loss is the weighted sum of the three loss components. The weighting may cause it to be lower than some of the components.
Observation loss captures how well the model predicts the Status and Trend distributions it was trained on. Its weight is always set to 1 and its relative weight is changed by adjusting the other to weights which are usually much less than 1.
Distance loss is lower when the routes encoded in the model are shorter.
Entropy loss is lower when the entropy in the model is higher.
Arguments
- bf
A fitted Bird Flow model
- transform
Passed to
ggplot2::scale_y_continuous()to set the y-axis transformation. Reasonable values for this function include "identity", "log", "log10", "log2", and "sqrt".
Examples
 bf <- BirdFlowModels::amewoo
 plot_loss(bf)

